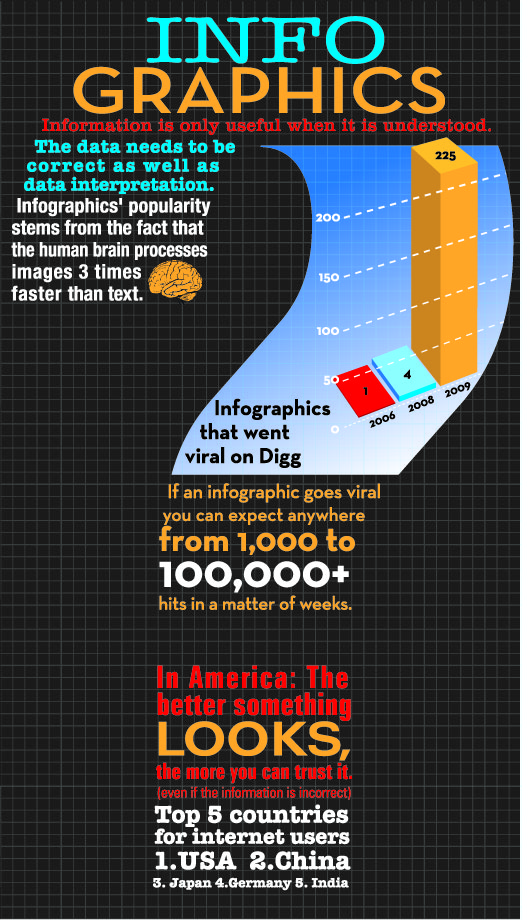
An Infographic on Infographics
2010 has often been called “the year of the infographic” due to the exploding popularity of infographics on the web. However, it seems very few people are actually quantifying this popularity, or sharing stats on infographics themselves. There is a plethora of information out there on how to design them, and thousands upon thousands of infographics on every subject from Facebook to cats. But after hours of research, we found that very few people are putting numbers or charts against this infographic growth.
As marketers, we’ve always recognized the value of portraying content in a visual manner and, as a result, we thought we’d take our first step into the infographic world. Below we have a few of the stats on the growth of this phenomnon, and some reasoning behind why they are so popular. Check it out and feel free to share any infographic stats you may have in the comments.
An infographic on infographics: